Blue Chip Supply Demand 

Trading Strategy

Blue Chip Supply Demand Trading Strategy is designed and tested extensively to provide traders easy to follow step by step guide for their trading journey.


You will find the detailed play book for this Trading Strategy below. Read the rules carefully to make sure you understand every trading rule for your trading success. As the market moves fast, you may not have enough time to refer this page while trading. Try to memorizing these rules, practice more and eventually you will be able to trade with your muscle memory.


Are you ready?


Before we get started, please understand this trading strategy is based on our 2 best trading indicators. You need to have the licenses to get started.

Sale Off
BG Blue Chip Indicator - Annual Subscription

BG Blue Chip Global is universal: it works with any market and with any time interval. It does not matter whether the market trades stocks, bonds, futures, Forex or any other freely traded market. It works well with Position trading, Swing trading or Day trading. Buy on the Blue Dot : Exit when price reaches Horizontal Blue Line Sell on the Red Dot : Exit when price reaches Horizontal Red Line

$495.00

Sale Off
BG Supply Demand Indicator

The BG Supply Demand indicator plots areas of support and resistance levels. By using this information, traders can visually identify potential price areas where price is most likely to reverse direction.

$495.00

1. Setup Your Chart

Open a new chart and apply following setup.

  • Choose instrument - ES
  • Use 1 Minute chart.
  • Use Candle Chart Style.
  • Add BG Blue Indicator to the chart
  • Add BG Supply Demand Indicator to the chart.
  • The factory default settings for BG Blue Chip would do.
  • For BG Supply Demand Indicator, please enable (check) "Show history", disable (uncheck) "Show only Prior Zones", disable (uncheck) Extend Zones.
  • Right click on the chart and go to Data Series and enter "Days to Load" as 1.
  • Enable Audible alerts on both BG Blue Chip and the BG Supply Demand Indicators. So you will be notified for every trading signals from both the indicators.

2. Trading Entry Signals


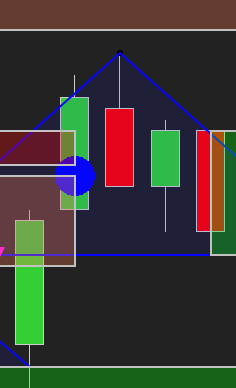
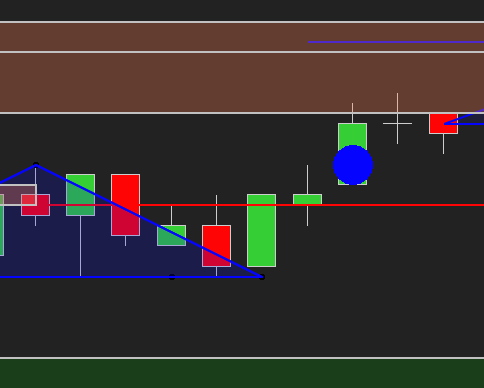
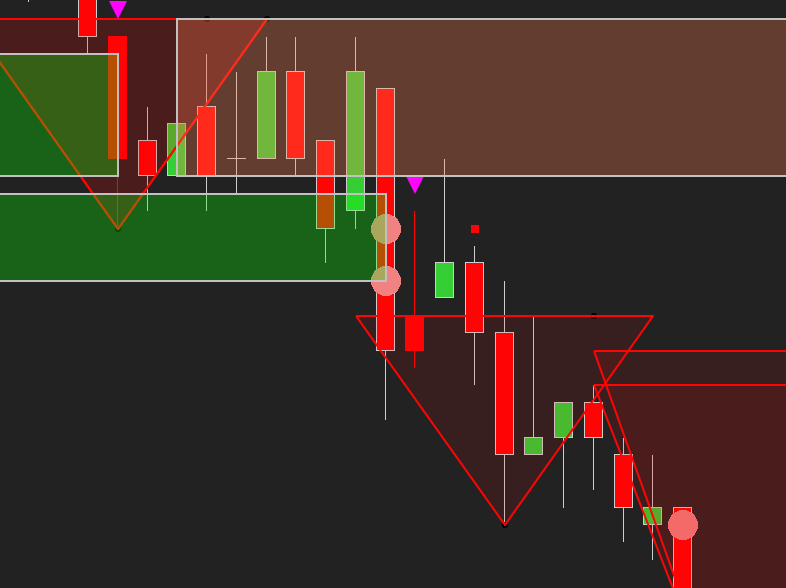
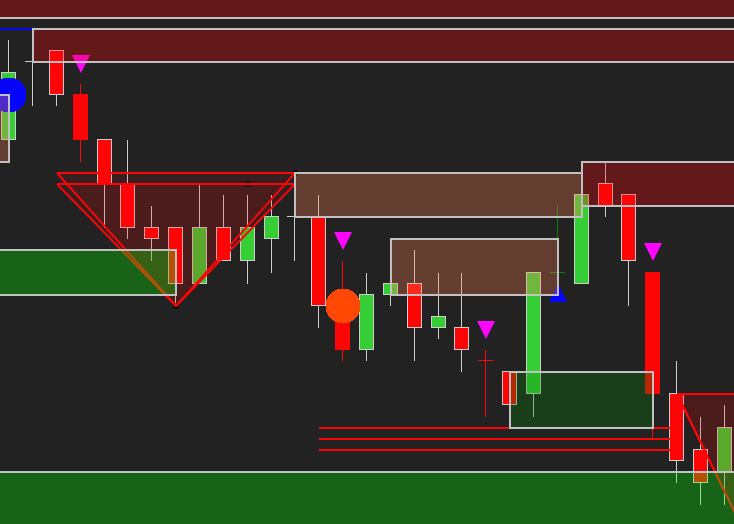
BG Blue Chip Indicator provides the long trade signal as blue circle dots and the short signals as red circle dots.

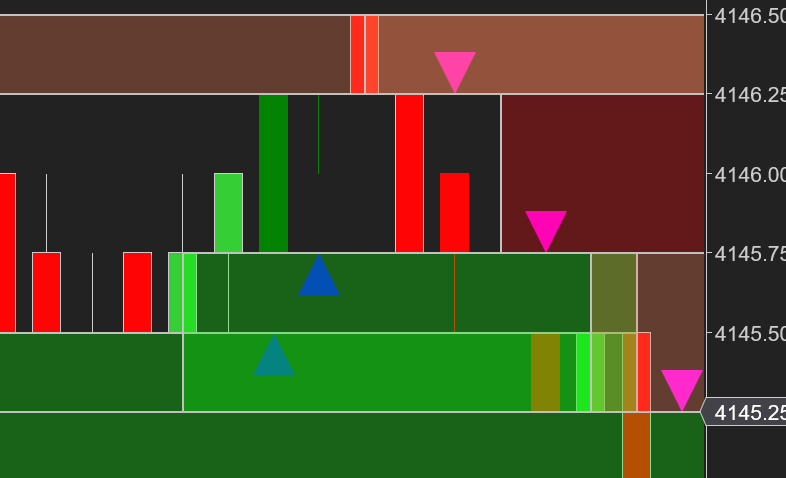
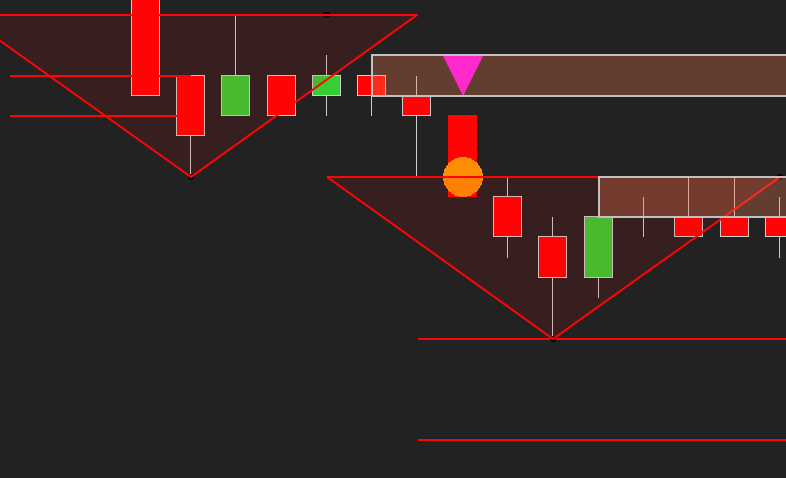
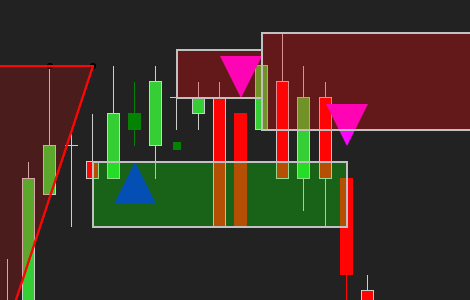
BG Supply Demand Indicator provides the long trade signal as blue up triangle and the short signals as pink down triangle.


Consider every trading signal and make sure all the following trading rules are satisfied before placing the trade.


3. Supply Demand is Support Resistance


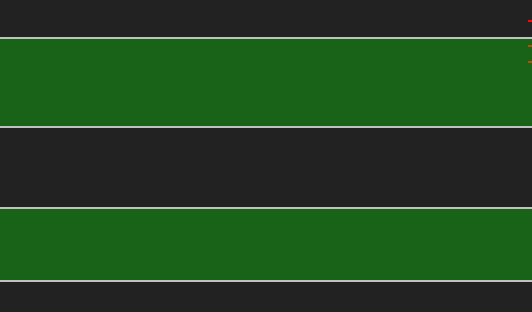
BG Supply Demand indicator provides real-time & historical support resistance in order flow data.


3a. The Red bars are resistance level.


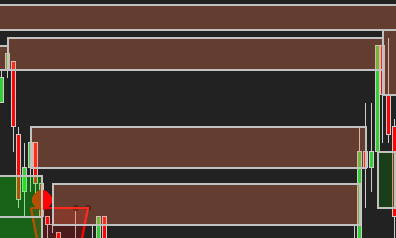
3b. The Green bars are support level.

4. Trading Playbook Rules


Rule #TR01:  Ignore the long trading signals on or very close to red resistance levels. Because support levels are far away and most likely it cannot penetrate the resistance level. These trades tend to reverse after touching the resistance levels.
examples:


Rule #TR02:  Same way, Ignore the short trading signals on or very close to green support levels. Its just reverse of the above rule for short signals.


Rule #TR03:  We need enough room between support and resistance. personally I prefer at least 4 points (16 ticks) between the support and resistance to consider the trades.  If there is no room, then it tends to be very choppy. In the following example screenshot, there is barely 1 points. hence I would not trade here.


Rule #TR04:  When there is a red short signal from BG Blue Chip indicator that is very close to red resistance level and far away from green support level, it's great signal to enter the trade right away for short
But make sure your trade entry price is again very close to the red resistance level and far away from green support level. 
If the price moves fast, please do not chase the trade and do not take the trade close to support level. 


Rule #TR05:  When there is pink short signal from Supply Demand indicator that is very close to red resistance level and far away from green support level, it's great signal to enter the trade right away for short.
But make sure your trade entry price is again very close to the red resistance level and far away from green support level. 
If the price moves fast, please do not chase the trade and do not take the trade close to support level. 


Rule #TR06:  All the trading signals are valid only for 1 or 2 bars from the signal. If you can't book the trade within 2 bars. please ignore that signal. because its too late.


Rule #TR07:  If the price moves fast and touched and goes very near the BG Blue Chip signal target lines, please ignore that trade. Because again its too late to enter trade, as the price already touched the estimated target price.


Rule #TR08:  Even if the short signal appears on the green supply level and if the bar penetrates and closes the price below green supply level, it is a valid short signal. But make sure the bar close price below the Green Supply level. 

Please look at the following screenshot with 2 pink short signals.  The first one is a bad signal. Because there is no room between Red resistant and green support levels. So ignore that signal. 
But the 2nd pink short signal produced strong orderflow and closed the bar after penetrating the green support line. Now this support level becomes invalid and this is a strong short signal to book short trade.

Here is another example where 


Rule #TR09:  Opposite of the above rule. Even if the long signal appears on the red resistance level and if the bar penetrates and closes the price above red resistance level, it is a valid long signal. But make sure the bar close price above the red resistance level. 


Rule #TR10:  Please do not trade without the signals even if there is large room between supply and resistance level and the price is near the green support level. The signals are orderflow confirmations. 


Rule #TR11:  Make sure every trade entries are acceptable by both indicators. the following screenshot is another example of the conflict.
BG Blue Chip blue dot indicates long signal and the red resistance from Supply demand indicator do not agree.  and you can see that price did not get past the resistance level and your trade would have failed.


Rule #TR12:  Ignore the signals in the middle. far from Supply and far from resistance. that means that trade can go either way. So avoid taking this risk.


Rule #TR13:  Ignore the signals in the middle. far from Supply and far from resistance. that means that trade can go either way. So avoid taking this risk.


5. Check this page frequently

We will be updating this page frequently with any new changes in the trading strategy. Please check this page every few weeks to have up-to-date knowledge on this trading strategy.

BACK TO TOP